This is the last in a series of posts on my exploits measuring and squashing reliability woes in the Continuous Integration (CI) automation of the Azure Communication Services web UI library. Other posts in this series: chapter 1, chapter 2 and chapter 3.
In March 2022, my team was struggling with engineering velocity because of a slow and unreliable Continuous Integration (CI) system. Worse still, we did not know, quantitatively, how bad the problem was nor had a good way to find opportunities for improvement. I took up the challenge and started by reporting key metadata for the CI jobs and defining top-line metrics to measure CI performance. The metrics first led me to the insight that the problem was not CI runtime, as initially assumed, but test flakiness. This data was also instrumental in spotlighting the tests that had a disproportionate effect on CI stability, finding failure patterns to zoom in on the root causes, and proving that my fixes were effective (and, at times, ineffective).
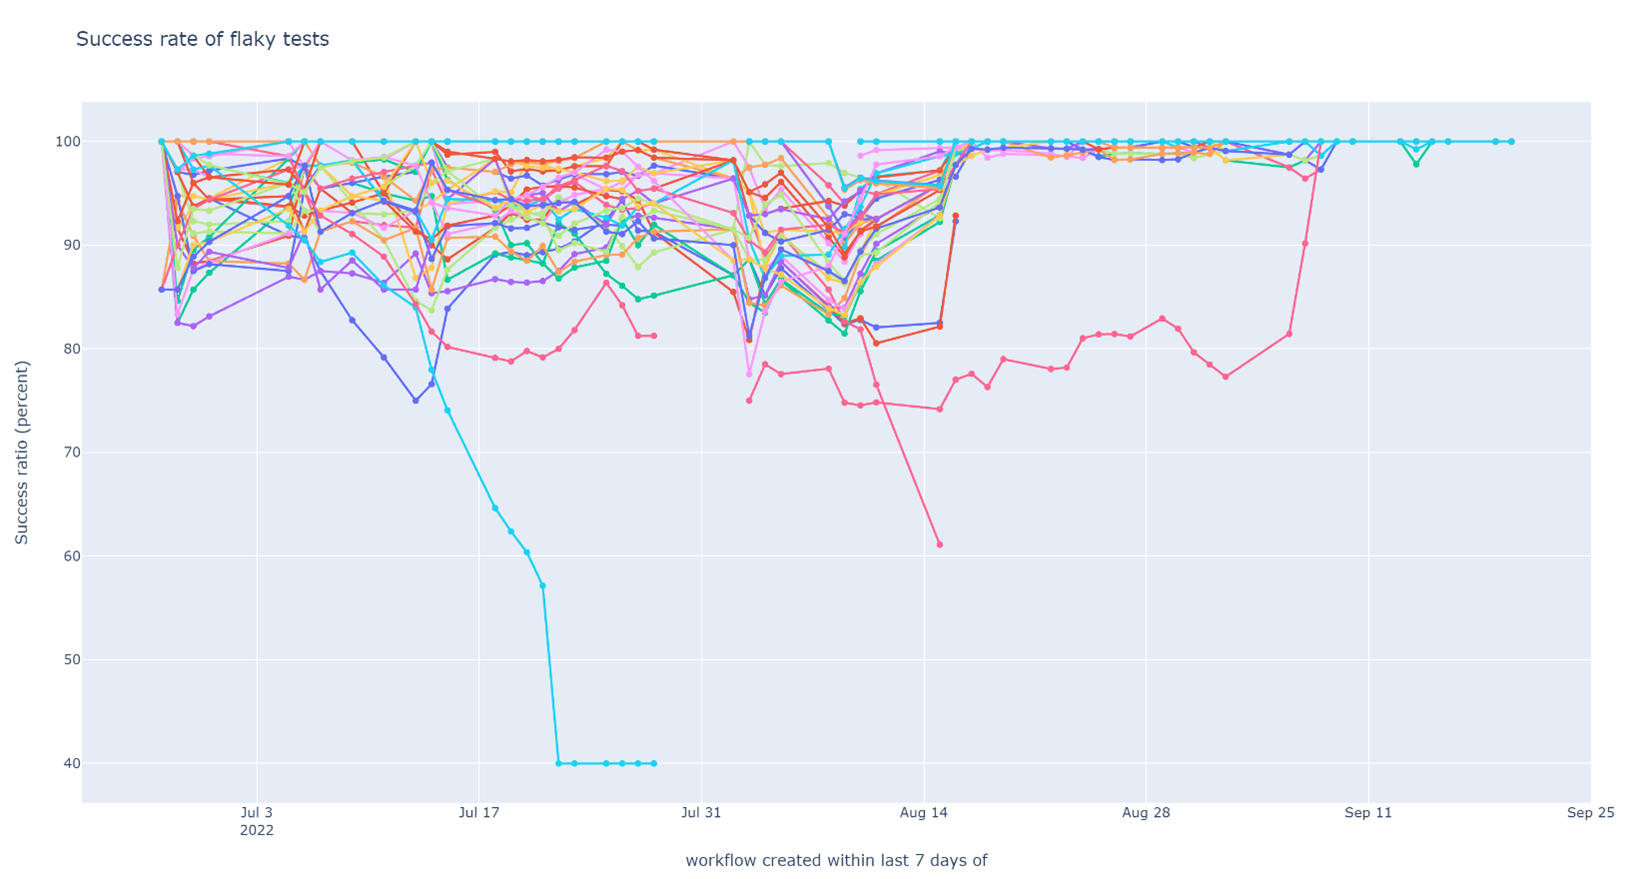
I fixed several issues besides those I discussed in detail in earlier posts in this series. Most of the issues were easy to fix once identified. Some were more of a rabbit hole, like the one in Chapter 3. One significant effort was conversion of certain live tests (tests that used the Azure Communication Service backends) to be hermetic (tests that ran completely in isolation from the environment). The hermetic versions of the tests were more stable, faster, and could be run concurrently. In the end, I was able to tame test flakiness to a degree beyond my expectations. The graphs do a better demonstration of the result than any effusive words:

Weekly success rate of tests in post-submit CI (higher is better), showing the time-span of the entire CI improvement effort. Flakiness was tamed and the graph stuck mostly to 100% for the last 10 days.
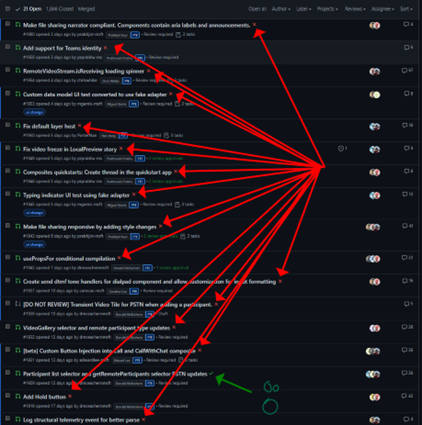
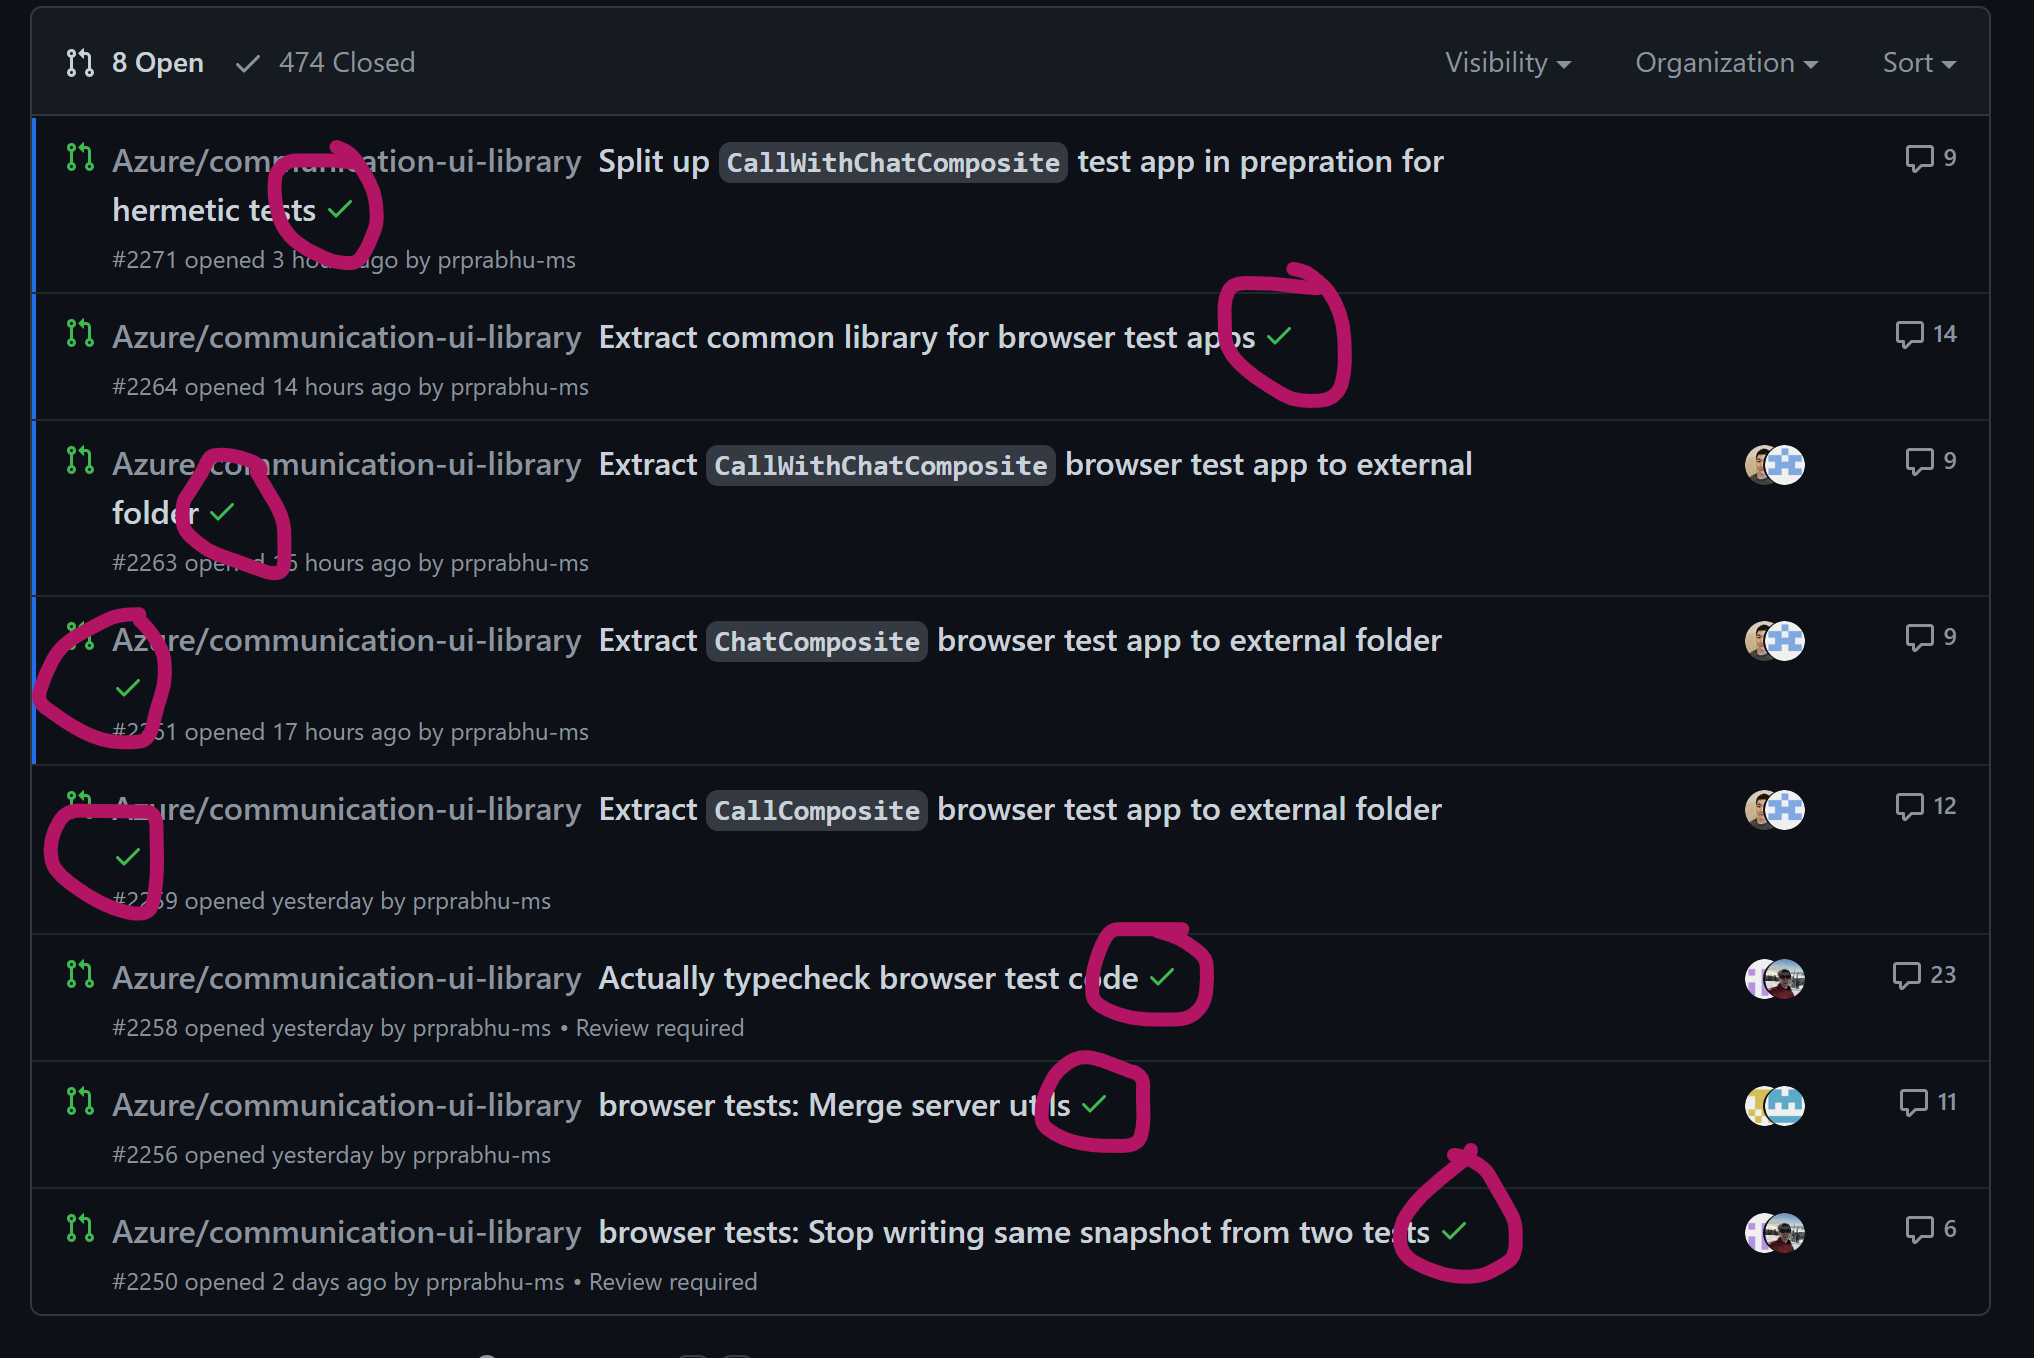
I hope that I have convinced you that visibility into CI performance via metrics was fundamental to my success in this effort. But there is a risk associated with instrumenting any system for visibility – you end up optimizing what you measure, not what the systems is meant to do. If your metrics end up being a bad measure of system behavior, metrics driven optimizations are a tossup – they might well work, fall flat, or even actively hurt your intended goals. In the end, a happy customer is what validates all engineering (and product!) efforts, even when the customer is yourself. I was able to safely put a lid on this effort because of the repeated positive feedback I received from my team about their experience with CI. I opened this flakiness can of worms with an anecdote. Let me finish with another, contrasting, one:

|

|
Team’s experience working with CI went from mostly-frustrated to not-thinking-about-it-anymore-good.
Where to from here? Engineering excellence is a journey not a destination. Getting CI in order is just the start. The harder task is maintaining the stability and runtime of CI so that it continues to be a good ally as we ship more features and delight more customers with the UI library while keeping the existing customers reliably happy. My cowboy metrics analysis setup was good for a couple months of iterative development, but will not stand the test of time when an entire team depends on easy access to CI metrics for the long run. Also, metrics are only good when used. The team is working on building the habit of leveraging similar metrics to keep an eye on CI. We now have the tools. We will soon have the processes. But above all, we shall always need, CONSTANT VIGILANCE 😉.
First post in this series: Chapter 1: Your problem is not what you think it is