This is the third in a series of posts on my exploits measuring and squashing reliability woes in the Continuous Integration (CI) automation of the Azure Communication Services web UI library. Other posts in this series: chapter 1, chapter 2 and conclusion.
Having squashed the obvious catastrophic test flake, I was left with many tests with 90% - 95% success rate. The overall impact on the probability of CI job failure due to test flakiness was still large – a case of death by a thousand cuts. Spot checking some of the failures, I found that a large source of test failures was a timeout waiting for naturally slow operations – enumerating camera, microphone, and speaker devices in the browser; SDK initialization steps that involved complex over-the-network handshakes; and rendering of remote video streams. The default timeout of 5 seconds for these checks was too short on resource-constrained CI virtual machines. I proposed a Pull Request to bump the relevant timeouts, trading potentially longer runtime for a higher success rate.
Proposing a fix for a flaky test is easier than proving that the fix works – a successful execution of the test is insufficient to prove that the test is fixed, because the broken test only fails on some executions. You must run the test multiple times and estimate the probability of success after the fix. It is not even necessary for a fix to reduce this probability to 0. Flaky tests frequently have multiple root causes of failures, and the fix might address only some of these root causes. You must compare the probability of failure before and after the fix to decide on its effectiveness. In the case of the read-receipt test earlier, I had used CI job metrics to assess the improvement in the test across my fix. In this case, I used a different GitHub Action to run the tests many times and compare the rates of failure. This way, I could reduce the time it took to validate a fix from several days to a few hours.
The relaxed timeouts helped with failures in device enumeration and SDK initialization, but the largest source of timeout – rendering remote videos – remained unaffected:
| Remote video timeout | Failure count |
|---|---|
| 5 seconds | 51 |
| 10 seconds | 60 |
| 20 seconds | 53 |
| 50 seconds | 58 |
The common symptom was captured in a screenshot by the failing tests – a loading spinner overlaid on top of the remote video.
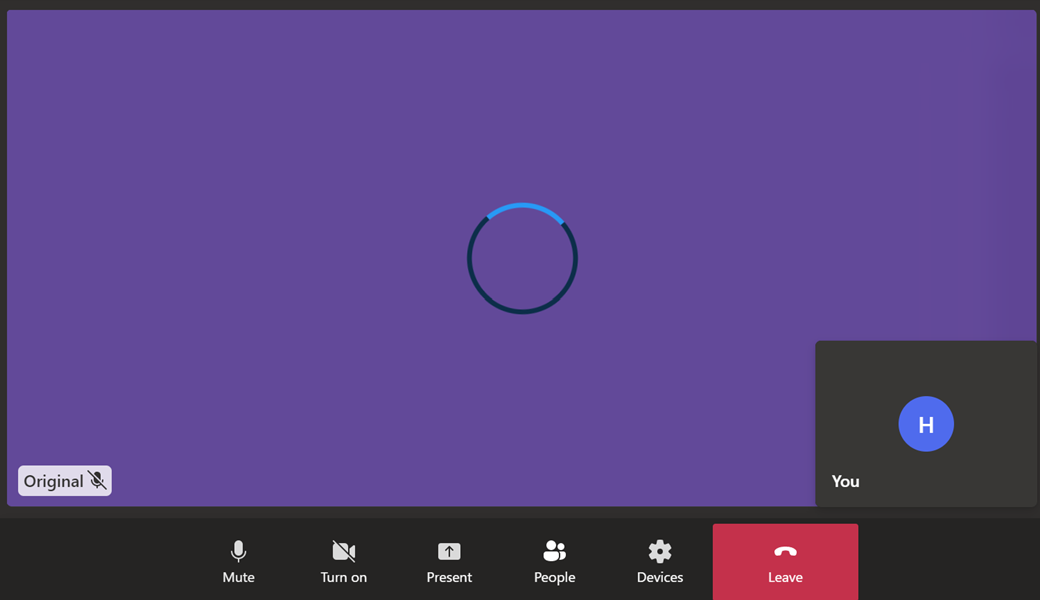
Screenshot taken by a browser test upon hitting a timeout while waiting for the remote video to load completely. The solid purple color in the background is the remote video and the rotating spinner on top is the problem – it means that the remote video hasn’t loaded fully or has been interrupted.
A typical browser test involving remote video is set up as follows: The test loads two instances of a sample application that connect to the same video call. For both instances, we use Chrome’s support for fake video devices and feed a video with a single solid purple frame as the remote video stream. The fake video is required for the UI screenshot comparison to work robustly – the captured video frame for remote video stream much match the golden files. Once both application instances have connected, the test waits for the remote video streams to load completely before executing the test-specific user journey. The tests were timing out because the remote video stream would never load completely, even after 60 seconds!
I reached out to Folks Who Know, and it turned out that the video calling infrastructure had a video quality detection feature that depended on the bitrate of the video stream. An uninterrupted video stream with bitrate lower than 2Mbsp (Megabits-per-second) was still classified as being of low quality. Simplifying somewhat, bitrate is a measure of the amount of data pushed over the network in a fixed unit of time (say, per second) for a video stream. The happy little solid purple frame of our test video just didn’t have enough happening to push a lot of bits over the wire. At first brush, the solution seemed simple (doesn’t it always?) – the video bitrate depends on the bits required for each video frame and the rate at which the video frames are sent (the frame rate):
bitrate ≈ frame size × frame rate ≈ (width × height × resolution) × frame rate
I created a new video (thank you ffmpeg) with a higher resolution static image and a higher frame rate, but that didn’t work:
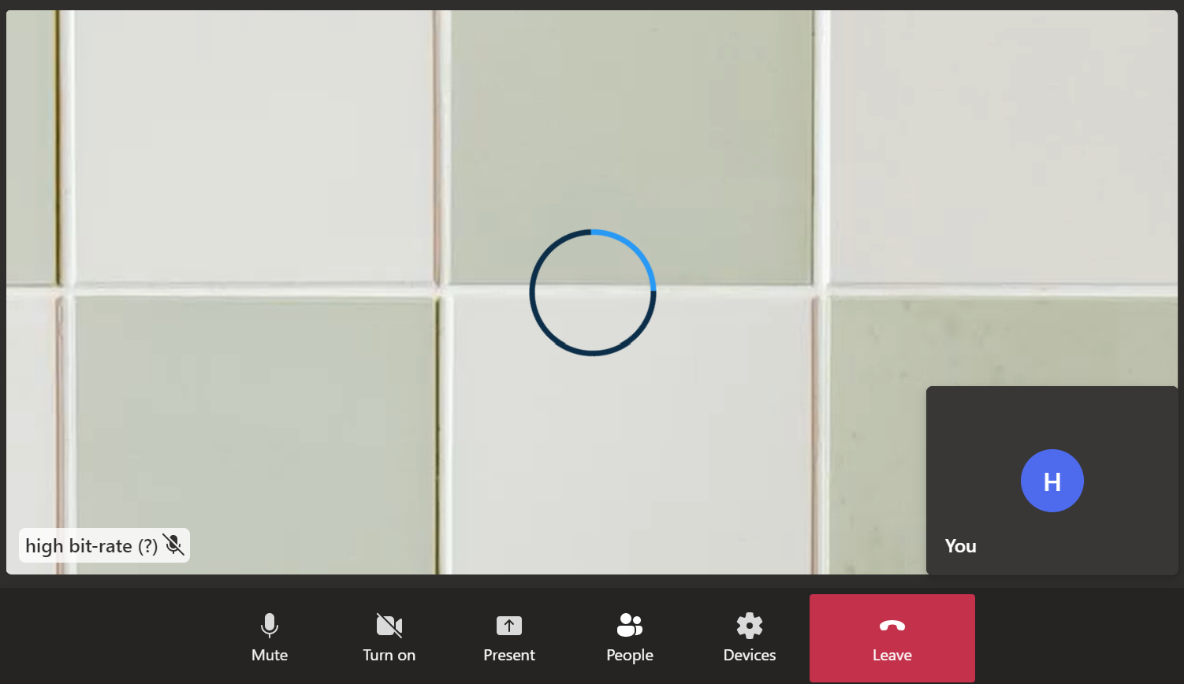
Video gallery with remote video comprised of a high-resolution image sent at high frame rate. The video bitrate was still lower than 2Mbps and the low-quality video indicator still caused timeouts.
I had missed the important fact that streaming video is never sent unencoded over the network. There are a series of highly efficient video codecs that minimize the amount of data sent over the wire for streaming video. I suspected that the default codecs were making quick work of my test video of a static image. And because bitrate measures the amount of data sent over the wire after the encoding, the bitrate was much lower than the unencoded rate suggested by the formula above.
Modern browsers provide basic statistics from the media stack that give you a look under the hood at the actual data being sent on the network. I used chrome://webrtc-internals to grab a graph of the outgoing video bitrate and confirmed my suspicion that it was much lower than 2Mbps and my expectations based on the source image and frame rate:
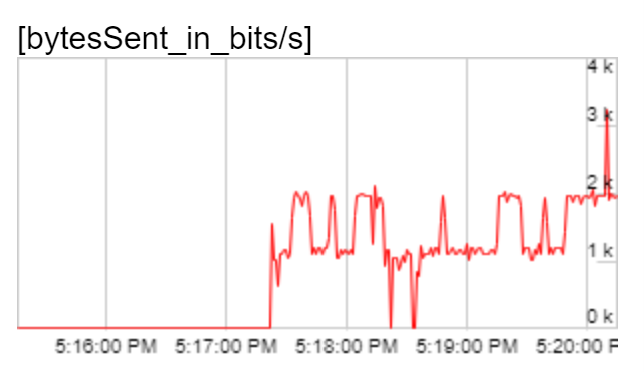
Outbound bitrate of the original solid purple video. Bitrate was much lower than the threshold of 2Mbps.
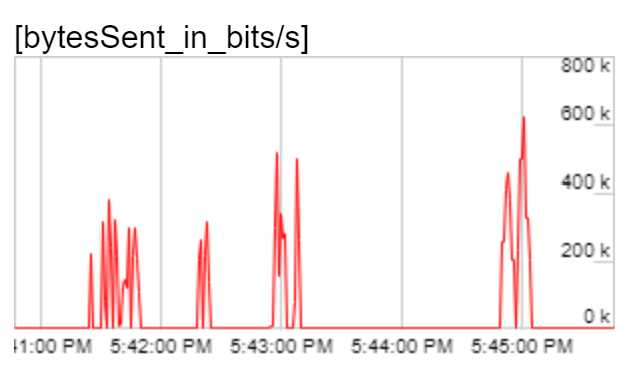
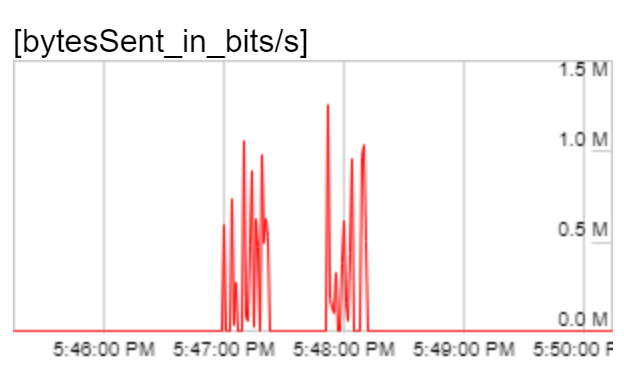
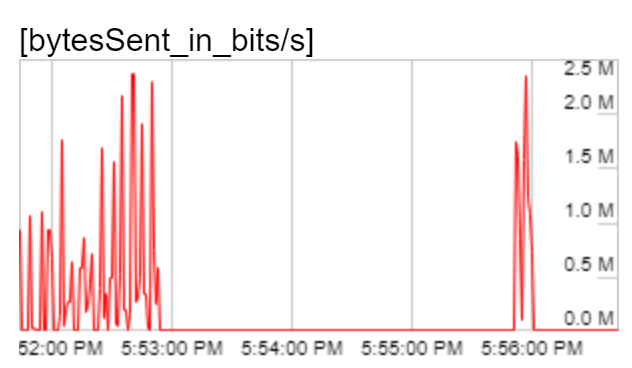
Now that I had found a way to observe the effective bitrate, I was ready to experiment. Video codec algorithms exploit patterns in the raw video stream to reduce the amount of information needed in the encoded stream. Randomness in the raw stream ought to make the job of the codec harder, and the encoded stream denser. I was forced to use a static image for each frame of the video (because the tests capture and compare screenshot of the video with a golden file) so I introduced randomness in the static image used. I generated a series of images with white background and black squares randomly distributed in the frame by varying the size and number of black squares used. The generated images were increasingly difficult to compress (as indicated by the size of the JPEG compressed static image). I created a test video with each static image and again observed the outgoing video bitrate:
| Square size / count | Screenshot | Outgoing bitrate graph |
|---|---|---|
| 32 / 128 | 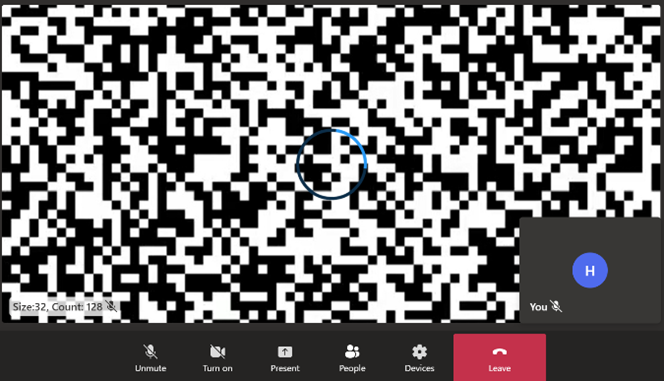 |
 |
| 16 / 256 | 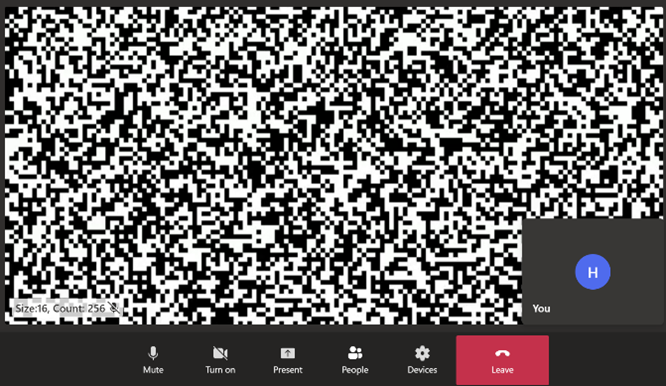 |
 |
| 8 / 512 | 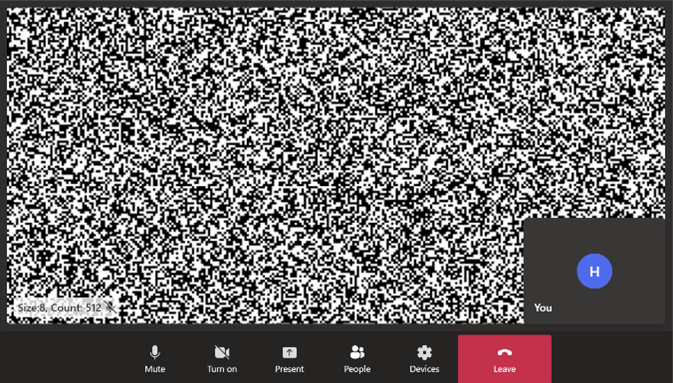 |
 |
| 2 / 2048 | 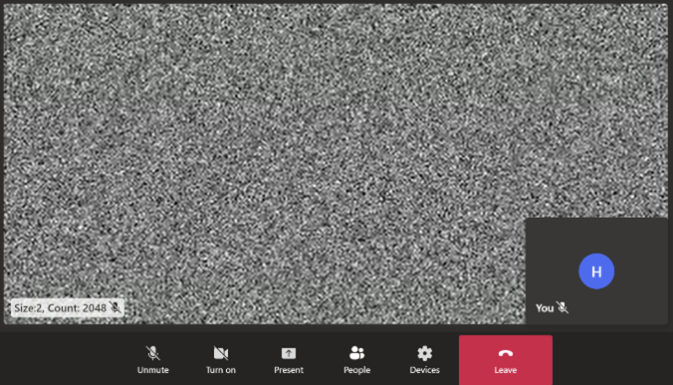 |
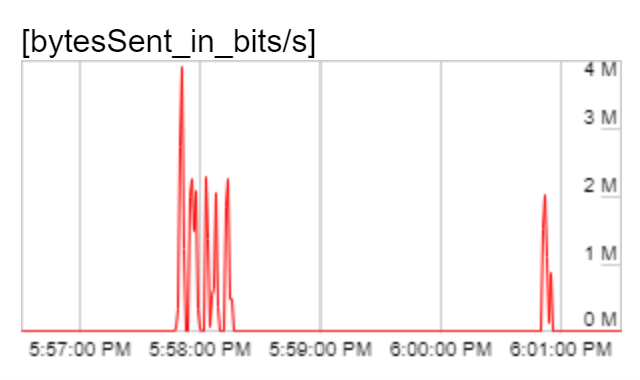 |
As expected, the peak outbound bitrate increased with the increased size of the static image – 600Kbps, 1.2Mbps, 2.5Mbps and 4Mbps respectively for the four cases. For the latter two cases, the peak outbound bitrate was over the threshold of 2Mbps. But, the bitrate wasn’t consistently high throughout the observation period. For a majority of the time, bitrate was very low (under 100Kbps). The video codecs needed a burst of data to communicate the static image intermittently but then did not need to send any information as the video stayed unchanging.
I could have continued this experiment with increasing complexity of the static images, but I noticed another effect in the remote video that made me abandon my experiment – shifting pixels in the remote video on the receiving end. Even though the outbound video comprised of a number of frames of a static image, the video on the receiving end wasn’t a static image after all!
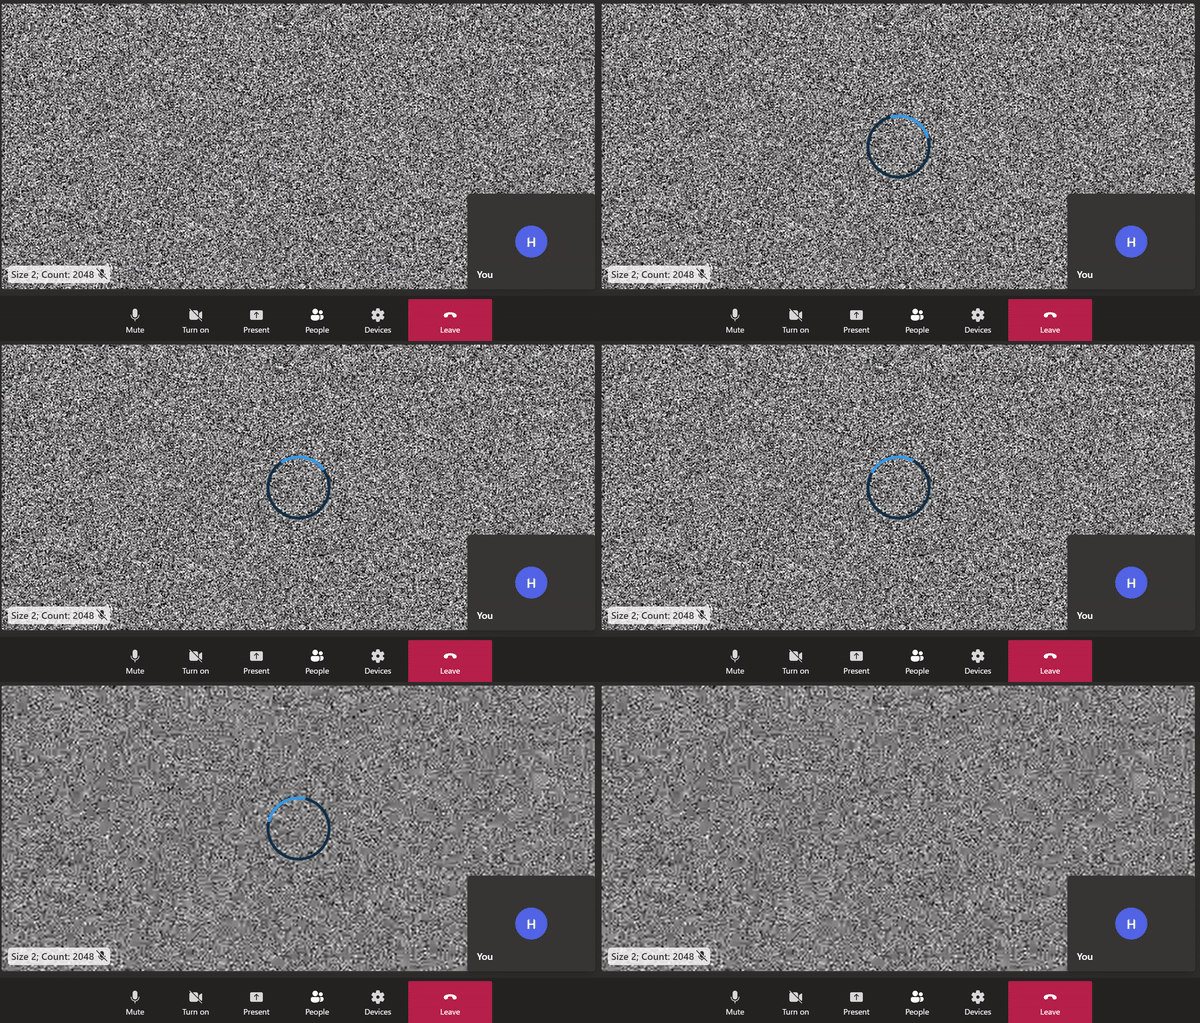
A screen-capture showing remote video comprised of a static image with 2048 2x2 black squares. Data loss during video encoding is visible as blurriness and a shift in the pixels. The loading spinner is also visible when bitrate drops between peaks.
I was forcing the outbound video to be dense by making it difficult to encode the raw video, and I was succeeding. The video codec was unable to fully compress the static frames within the available time and so it was doing its best and sending a compressed frame that was not faithful to the frame from the raw video. Video codecs use lossy compression techniques. The harder the input to compress, the more information is lost during compression. On the receiving end, this shows up as video artifacts, like blurring, as seen above.
I was left with a conundrum. For simple static images, the codec succeeded in lossless encoding. The remote video on the receiving side was crisp. There were no video artifacts. But the video was classified as low-quality by the video calling infrastructure and caused timeouts in the tests. For complex static images, there was data loss in encoding and the remote video had compression artifacts that led to mismatches in UI screenshot comparisons in the tests. I do not think it is possible to craft a video from a static image such that there are no video artifacts and yet the outgoing video bitrate is over 2Mbps.
The workaround
My final solution was a rather simple workaround I had been resisting for pedantic reasons. I used a high bitrate video (of a bus) for the fake camera in the test. Because the video had motion, it was not possible to include the video tile in UI screenshots. So, I masked the rendered video programmatically in the sample application used in the test. I had avoided this approach earlier because the UI screenshots no longer contained the actual video being rendered. But this was an acceptable compromise - the browser tests were never intended to validate that remote videos were rendered faithfully.
The workaround was very effective. The number of video rendering timeouts during stress testing dropped from 60 to 0 after the fix. The improvement in test stability was also clearly visible in the test flakiness graph after I merged my workaround.
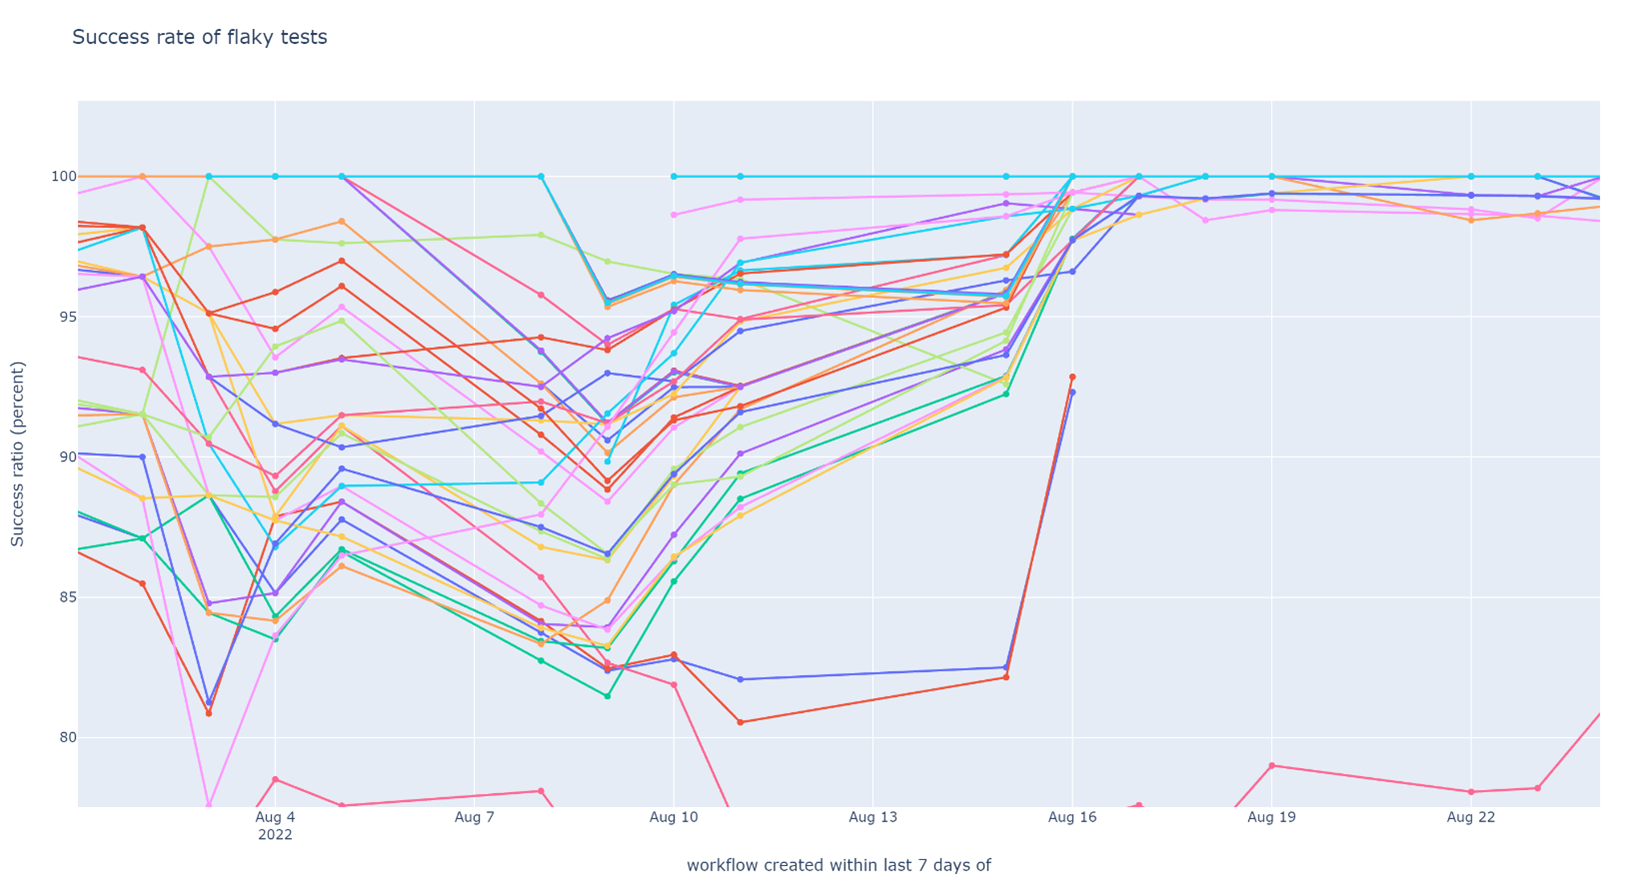
Weekly success rate of tests in post-submit CI (higher is better). A lot of tests 90% - 95% success rate became a lot more stable after the video quality issue was resolved. Not all of them succeeded 100% of the time – there were other causes of (minor) flakiness that had to be dealt with separately.
This example showcases why fixing flaky integration tests can be hard – there are large systems involved and flakiness can arise and propagate from any of them. Especially when testing applications and libraries at a high level of abstraction, it is easy to misunderstand the constraints of the underlying architecture and break them in ways that are not sensible in production environments.
Unfortunately, there is no silver bullet here. When you start following the trail of a flaky test, it may go deep and into unchartered territory. Fortunately, there is no silver bullet here. When you start following the trail of a flaky test, it may go deep and into unchartered territory. It all comes down to a cost-benefit analysis. I maintain that the cost of having flaky tests is high in terms of loss of confidence in CI and engineering velocity in the long run, and that the benefit of following a trail successfully is joy unto itself.
Next post in this series: Conclusion: What did we achieve and where do we go from here?