This is the second in a series of posts on my exploits measuring and squashing reliability woes in the Continuous Integration (CI) automation of the Azure Communication Services web UI library. Other posts in this series: chapter 1, chapter 3 and conclusion.
Soon after I started tracking my metric for test flakiness, the metric jumped to nearly 100% - most CI jobs were failing only because of test flakiness.
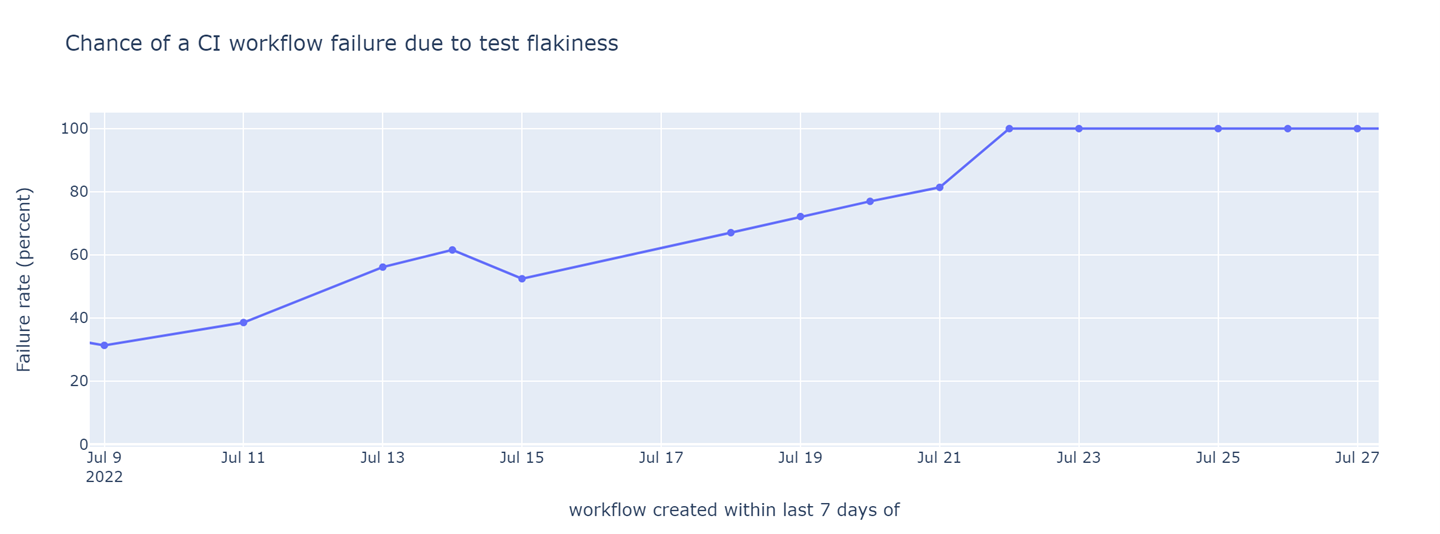
Probability of a pre-submit CI job failing due to test flakiness (lower is better). The probability of failure shot up to 100% on Jul 21 and stayed there for a week.
A CI workflow that often fails for reasons unrelated to the software under test is far worse than no CI at all. It costs the developers effort to understand the failures on their Pull Requests, delays merging of Pull Request due to unrelated failures that need to be manually retried, and provides no benefit when it eventually succeeds because of a loss of confidence in the CI. A CI workflow that fails every time because of flakiness is essentially a day off for the engineering team.
Earlier, I had struggled to find opportunities for large improvements in CI job runtime – there were no obvious tests whose runtime could be improved by a large fraction and that would lead to a corresponding improvement in the job runtime. Not so with flakiness – almost all of the sudden jump in test flakiness was caused by a single test:
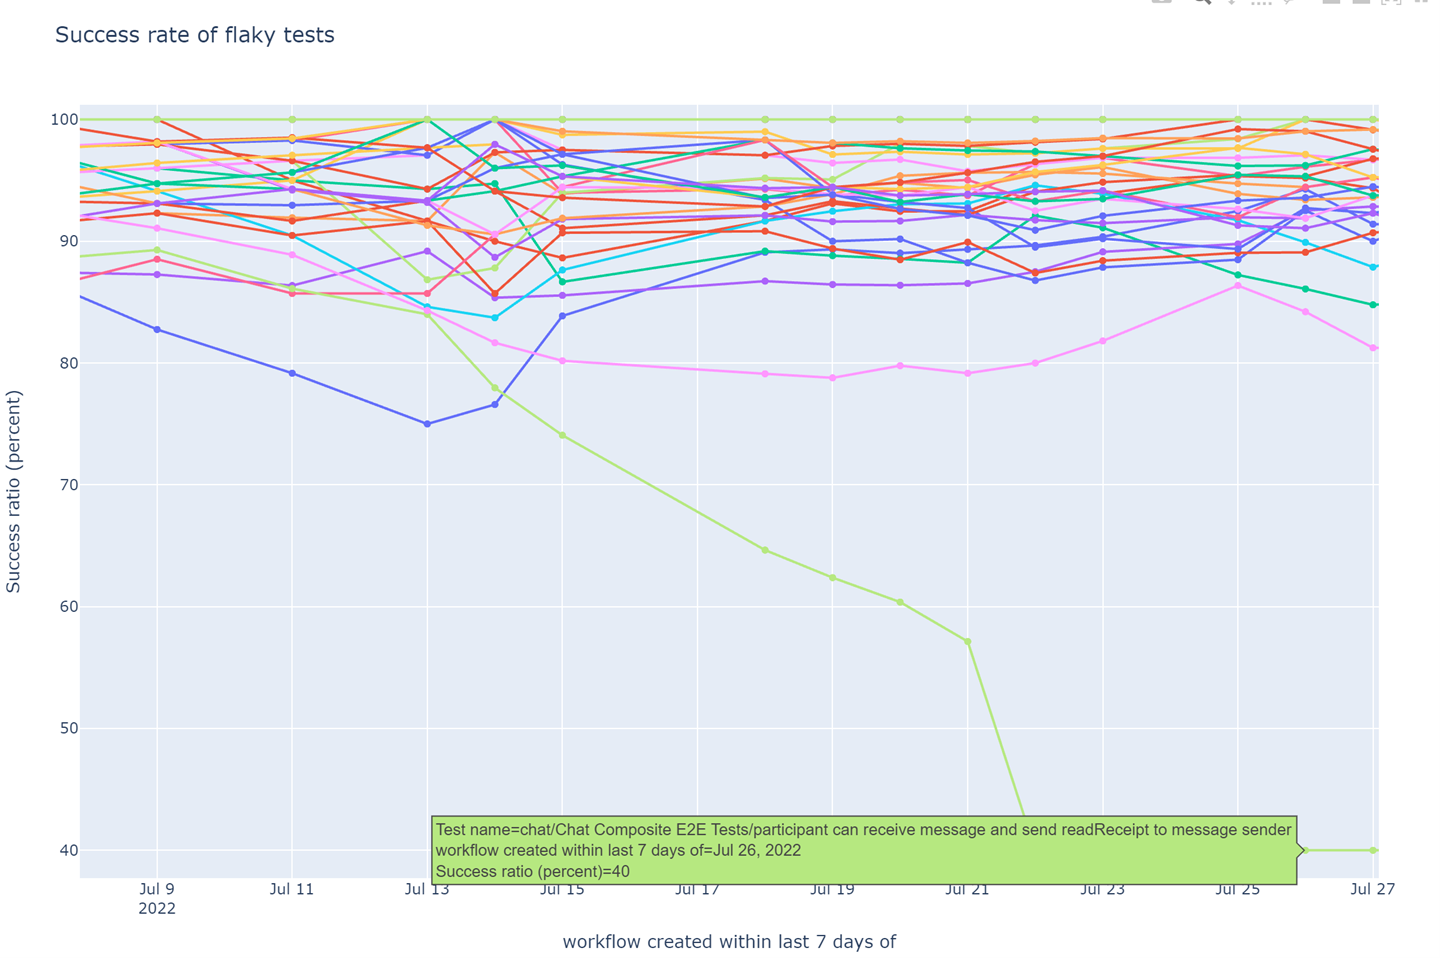
Weekly success rate of tests in post-submit CI (higher is better). The sudden decrease in stability of a read-receipt test is clearly visible.
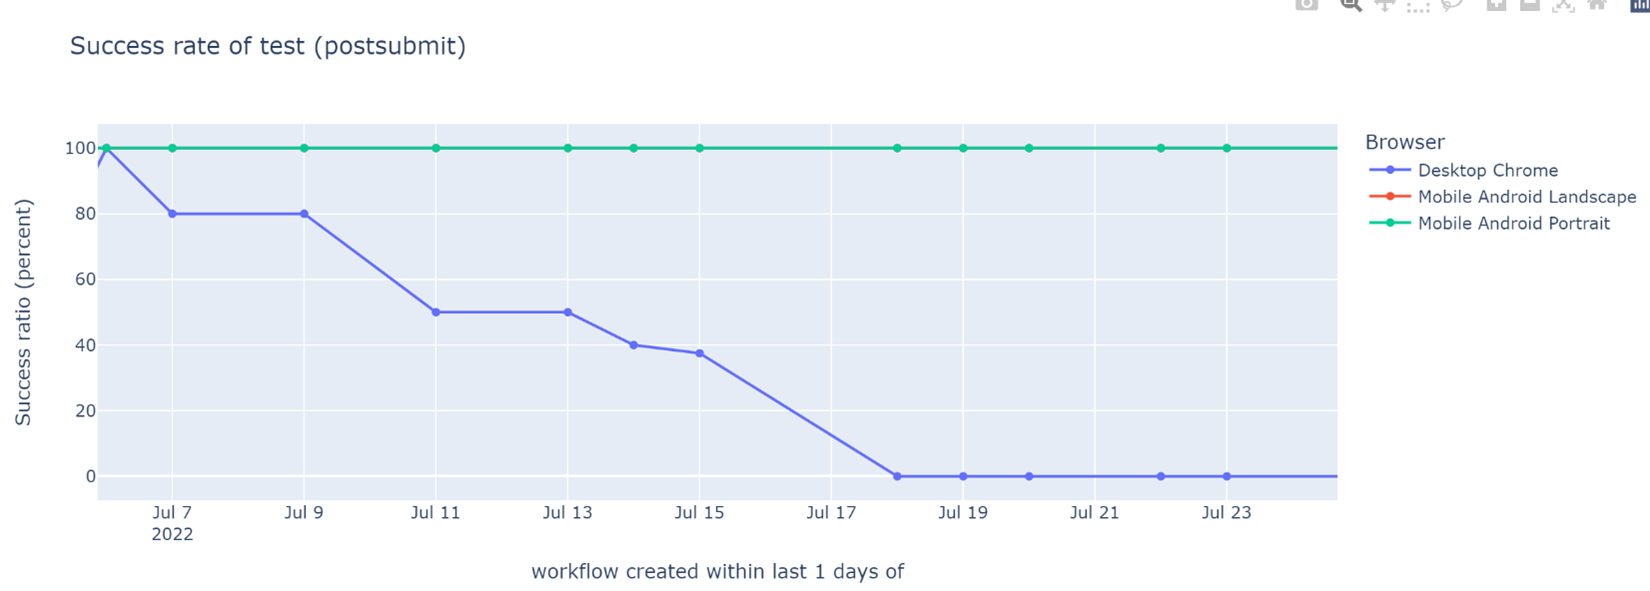
The success rate of a particular read-receipt test dropped from about 90% to 40%, and stayed at exactly 40% for a week. There is always some variance in metrics on a real-world process. Because the success rate stayed stubbornly constant, I suspected that there was a flaw in my data collection or processing steps. Some exploratory data analysis of the success rate of the affected test uncovered an obvious reason (in hindsight) for the 40%:
Weekly success rate of tests in post-submit CI (higher is better). The sudden decrease in stability of a read-receipt test is clearly visible.
Each test in our CI is run on three browsers – Desktop Chrome, Android browser in landscape view, and Android browser in portrait view. For each browser, the test is retried twice on failure (i.e., maximum three attempts per browser). This test was failing on Desktop Chrome a 100% of the time. Thus, each CI job successfully ran the test once each on Android landscape and portrait views, and three times unsuccessfully on Desktop Chrome. Hence the stubborn 40% success rate. This was welcome news - a test that fails a 100% of the time is a lot easier to deal with than one that fails only intermittently.
I debugged a recent test failure and found that the problem was in an image comparison between a UI screenshot and the golden file.
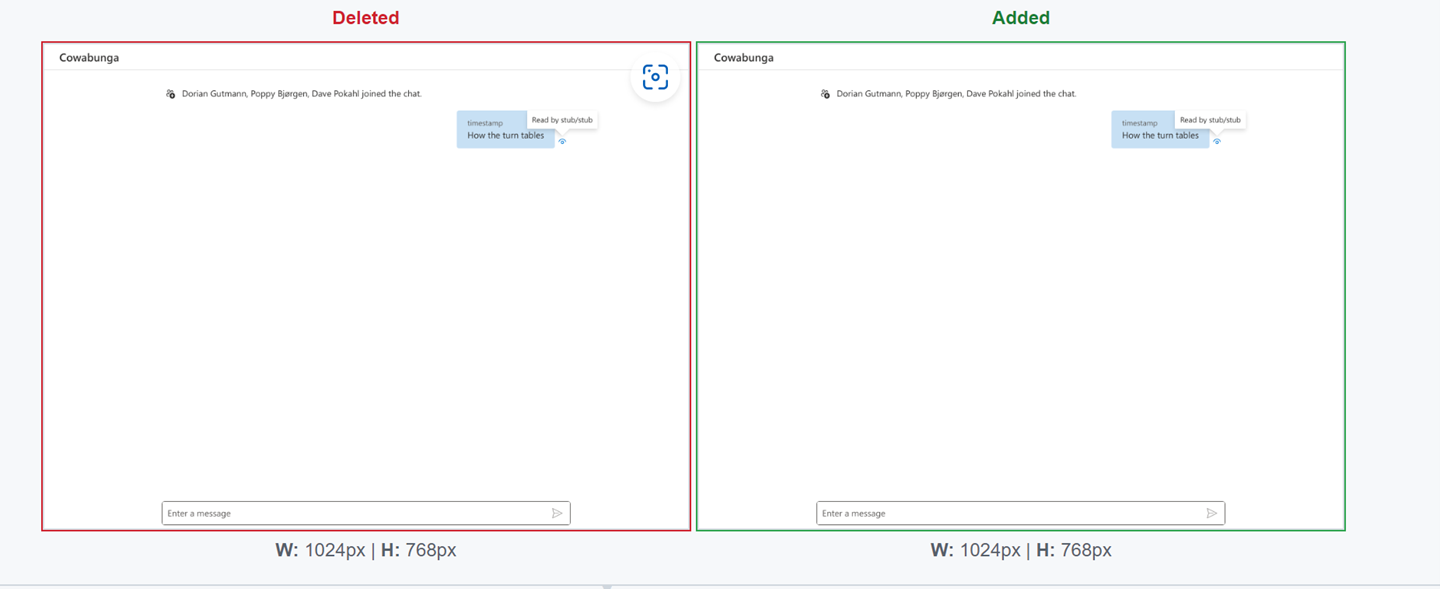
A tooltip in the UI screenshot was a few pixels off as compared to the golden file (go on, stare away at those screenshots…). I was never able to reproduce the bug on my workstation – my local test run always generated the same UI screenshot as the golden file and the test would succeed. I hypothesized that this bug only reproduced in CI jobs because they run on virtual machines which tend to be more resource constrained than my development workstation. In the test, the text in the tooltip was modified programmatically and then a UI screenshot was captured. I guessed that the tooltip was auto-resizing to re-center the text, but the resizing wasn’t fast enough on the CI machines – the UI screenshot was captured before the tooltip could resize (with the text off-center). By fluke, the golden files had been updated to the post-resize screenshots by an earlier CI job. Following that CI job, all CI jobs started failing the screenshot comparison. With some code archeology, I was able to find the Pull Request that had updated the golden files to the highly unlikely screenshot. That Pull Request was entirely unrelated to the test that started failing, but it converted a flaky test that failed very infrequently to one that failed all the time. I merged a speculative fix based on this informed guess of the root cause of the issue.
Once I realized that this was a consistent failure on a single browser, it took me less than a day to root cause the failure and find a fix. The funny part is that it then took me several days to prove that my fix had, in fact, worked.
Some of my data is gone, and I don’t know which!
Having merged my speculative fix, I expected the success rate of the affected test to start rising (slowly, because of a 7 day rolling aggregation window). Or, if my fix had failed, I expected the success rate to stay unchanged.
Neither happened.
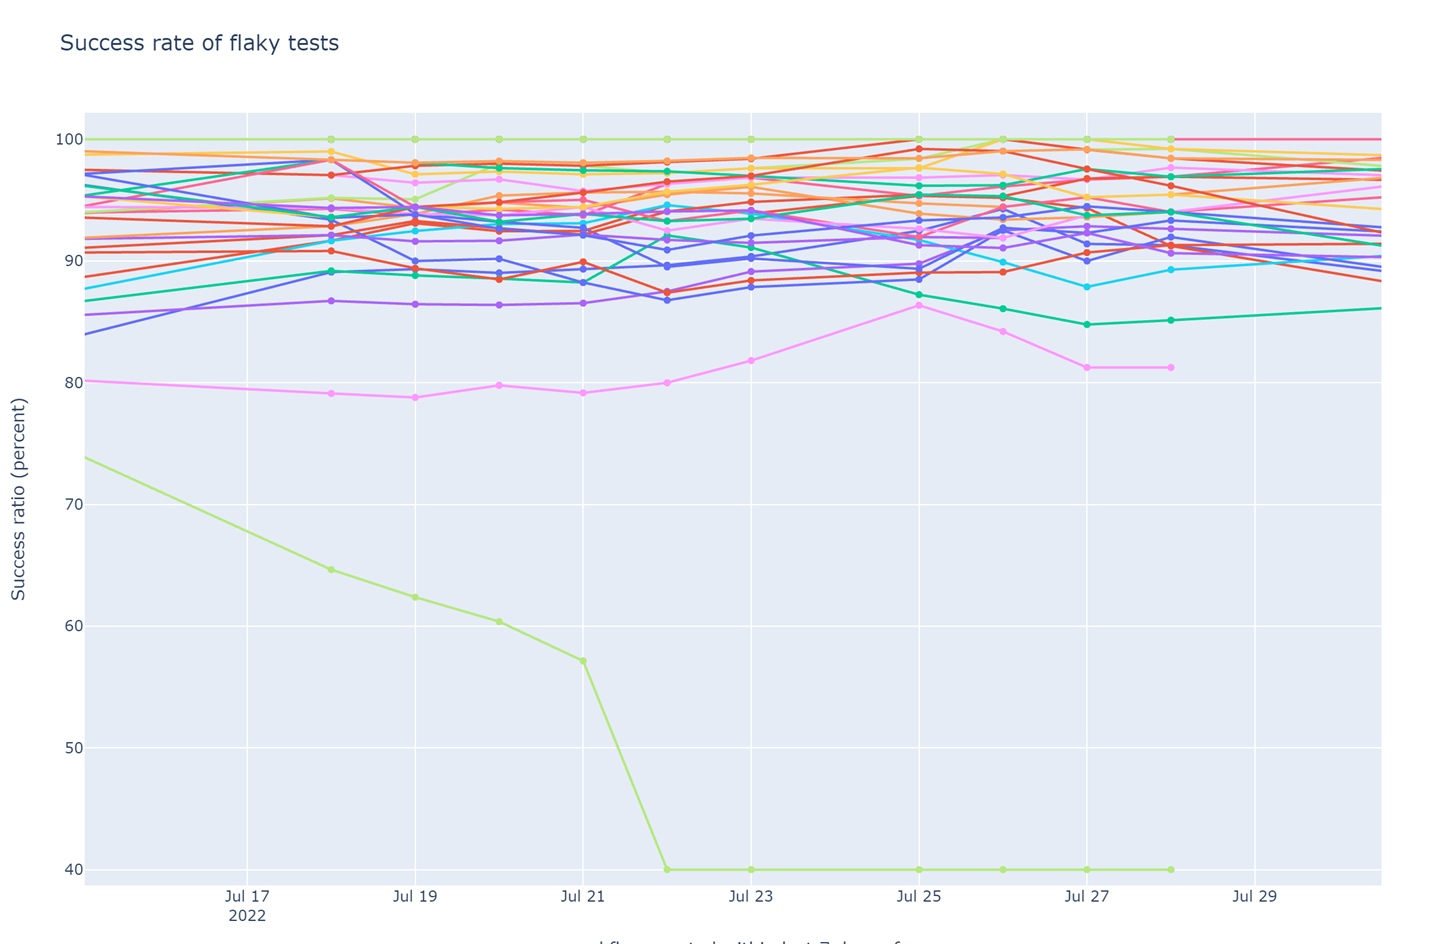
Weekly success rate of tests in post-submit CI (higher is better). My fix was merged July 27. Data stopped being reported for affected test July 28.
The graph for the success rate of the affected test simply disappeared a day after I merged my fix. It took a combination of sleuthing and luck to figure out what was happening. tl;dr – CI was reporting test statistics only partially for 18 days before I noticed it because of my work on this flaky test. There were multiple twists in this fortnight of incomplete data:
| July 14 | I merged a Pull Request that started invoking Playwright twice instead of once. The second invocation started overwriting the test statistics generated from the first one. Thus, test statistics from the first invocation were lost. |
|---|---|
| July 15 | I merged a Pull Request so that hermetic tests, including the read-receipt test, were run in the first invocation and live tests were run in the second invocation. Thus, the test statistics for the read-receipt test would be overwritten by the those for live tests. Incidentally, this Pull Request also changed the behavior so that the second invocation only happened if the first invocation was completed successfully. Because the read-receipt test was failing 100% of the time on Desktop Chrome, the live tests were never run and the test statistics for the read-receipt test were reported. |
| July 27 | My speculative Pull Request fixed the read-receipt test. As a result, the first invocation of Playwright started completing successfully. The live tests started to run in the second invocation and overwrote all tests statistics for the first invocation. I stopped seeing any data for the now fixed read-receipt test! |
| Aug 3 | I figured all this out and fixed the CI job to avoid overwriting test statistics from the first Playwright invocation. |
Once I fixed the data reporting bug, I could finally confirm that my fix had worked – perfectly:
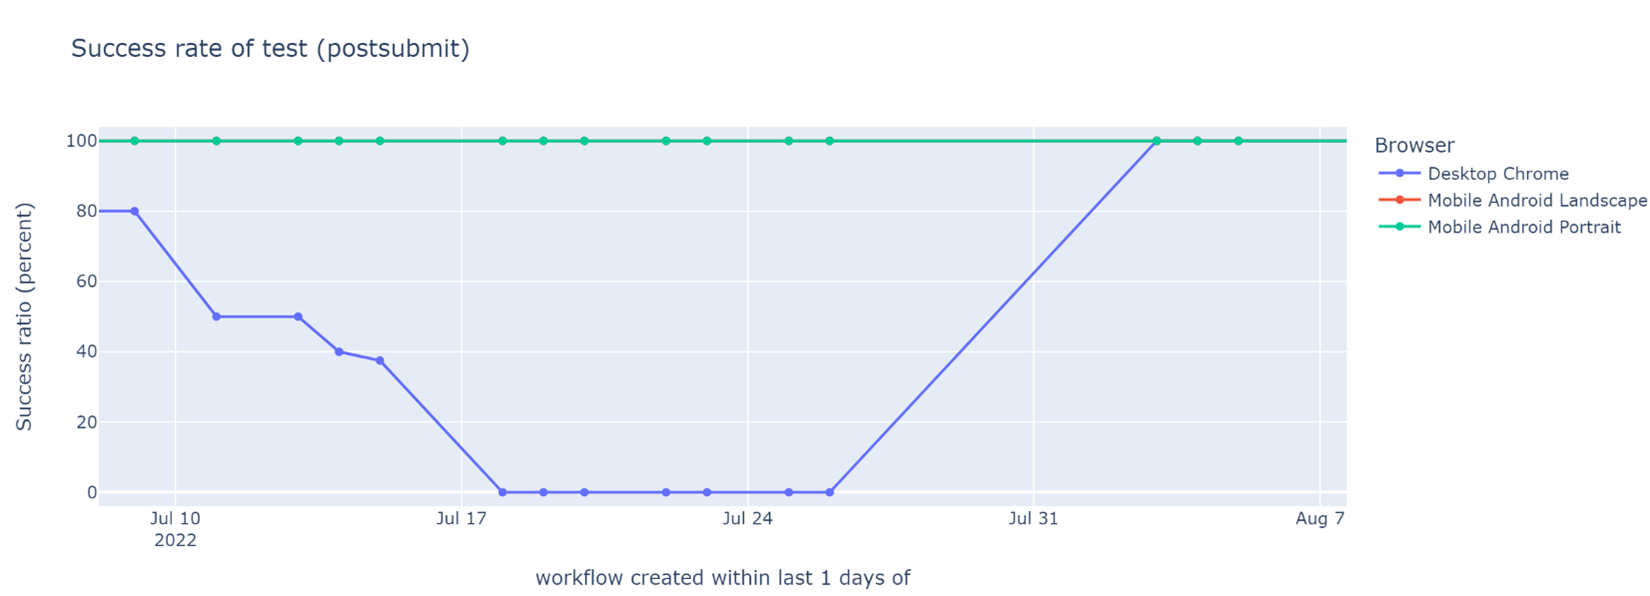
Success rate of a read-receipt test, split by target browser (higher is better). The graph for Desktop Chrome satisfyingly jumped back to 100% after some data quality ninja work.
As a follow up to my data quality ninja work above, I added a supplementary graph tracking the number of unique tests run each day. This graph clearly showed the data loss on July 25 and July 27 (exactly how many tests were reported on this graph depended on what tests were succeeding in CI) and the recovery on Aug 3.
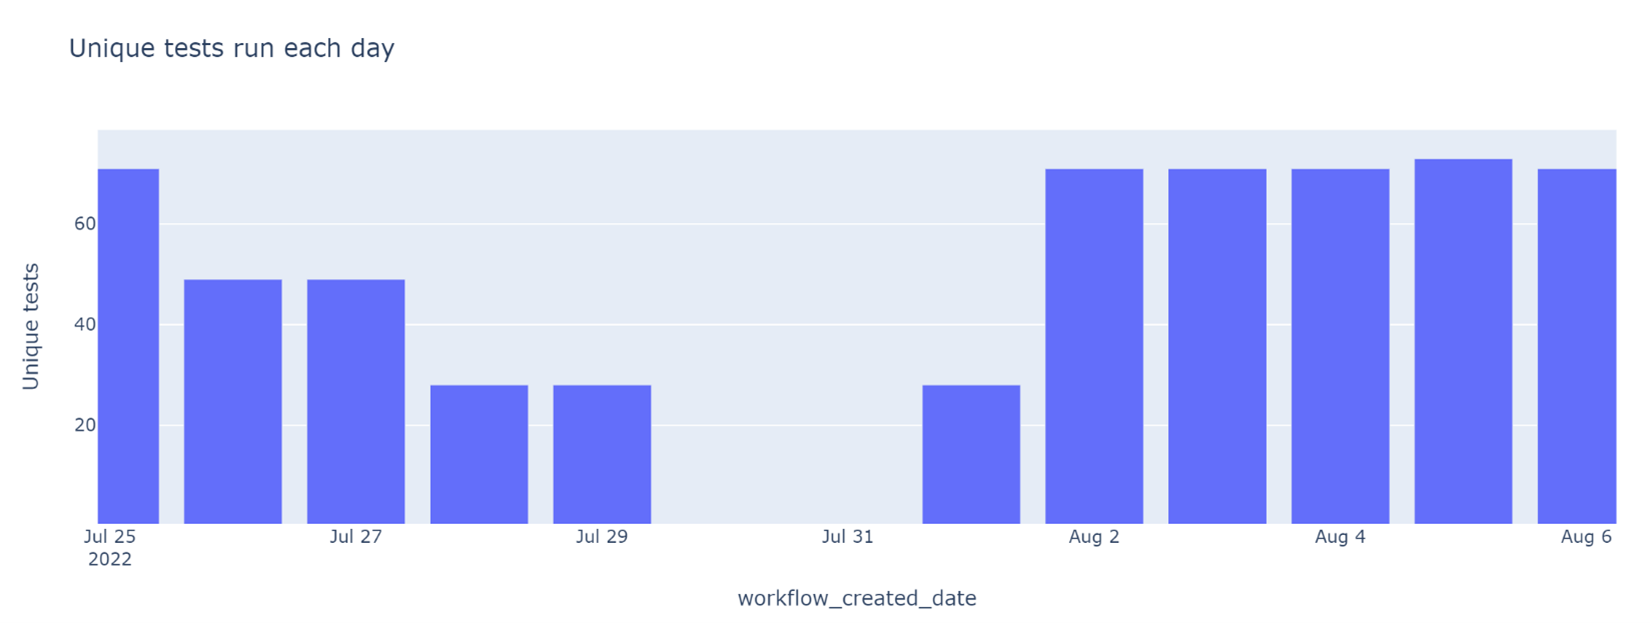
Unique tests run each day. The number is expected to stay mostly constant, changing slowly as new tests are added or old tests are retired.
There is a moral here for your next data-driven engineering effort – work on data quality should be an essential and ongoing part of such a project. You should treat inferences from data analysis as provisional until validated by independent data, sampling, or actual system behavior. Also remember that supplementary data analysis is often key to a high-quality data analysis pipeline.
Next post in this series: Chapter 3: WebRTC has the last say