This is the first in a series of posts on my exploits measuring and squashing reliability woes in the Continuous Integration (CI) automation of the Azure Communication Services web UI library. Other posts in this series: chapter 2, chapter 3 and conclusion.
Azure Communication Services is a platform you can use to integrate communication services – video and telephony calling, chat and SMS messaging, email etc. – into your applications on the web, mobile or desktop. The offering includes a web UI library that provides UI controls of varying complexity on top of the platform. The UI library handles the complex interactions between UX, the browser and the platform services so that you can focus on branding and deep integration with your business flows.
Web UI library development poses very interesting engineering challenges because of the library’s unique position in the Azure Communication Services ecosystem. First, the library has complex dependencies on the Azure Communication platform because it integrates various platform services developed and released independently. Second, it has a large programmatic and UX contract with client code to support polished branding and frictionless integration with the customers’ applications. Finally, the library has seen a lot of active development since its release in late 2021, and will continue to do so as the Azure Communication Services platform grows. The library must hide the platform’s complexity, support a large API surface, and consistently maintain a high quality bar, all while shipping out features at a steady clip to existing and new customers.
I don’t need to advertise the importance of Continuous Integration (CI) given these requirements. Our team recognizes this need. Since the 1.0.0 release, the library has been supported by Github Actions based CI that employs code linters, unit-tests, and Playwright-based browser tests. This early investment in CI has paid off. The team has shipped a minor version of the library roughly monthly through the last year, including some big features, relying on automation to maintain high quality and low risk.
My team’s journey with CI automation in the last year wasn’t all rainbows and sunshine. In March 2022, about 4 months and a few minor releases after the 1.0.0 release, the experience of developers with CI was lukewarm. Developers were paying a high cost for CI because of increased friction from slow builds. There were internal debates on the cost-benefit ratio of CI considering this friction. I took a first stab at this problem in a Microsoft-internal Hackathon and was able to demonstrate a reduction in the total machine-time consumed by a CI run of 38% by switching from webpack to esbuild for building sample applications. But the overall latency of CI is what matters in a pre-submit CI – it is the minimum time taken to complete a developer’s request to merge an approved Pull Request. I was only able to achieve a modest improvement of 11% in CI latency, and it became apparent that the real bottleneck was the time taken to execute the Playwright tests.
At the time, browser test execution involved launching a modified Chromium browser, loading a sample application in the browser, and then walking through key user journeys in the application. Typical tests sent chat messages and joined video calls against live Azure Communication Services backend. There were over 60 browser tests in the test matrix and they had to be run sequentially to avoid failures due to API throttling. The result: a slow and potentially fragile CI that was likely to get worse as more features (and tests!) were added to the library. I had previously experimented with replacing some of the backend dependencies for browser tests with in-memory fakes and, in July 2022, we decided that it was time to speed up browser tests by replacing more backend services with fakes.
But before I began, I wanted to know the exit criteria for the effort – current and target CI runtime upon completion of the project. It turned out that we did not have a good estimate of the current runtime. I had a clear quantitative question to answer; it was time to reach for some data. Unfortunately, I found that GitHub Actions do not expose CI analytics (in contrast, Azure Pipelines do). I instead built a low-tech data-analytics pipeline myself that allowed me to experiment fast at the cost of some additional toil.
- I enabled a Playwright reporter in CI to generate test statistics at the end of a test run and uploaded the statistics as a CI artifact.
- In a separate GitHub repository,
- I wrote a tool to fetch the uploaded test artifact and Github Actions metadata using GitHub REST API (I also explored GitHub GraphQL API, but found that it would not have made a material difference to the effort required).
- I wrote a series of Jupyter notebooks to process and analyze the fetched data.
This approach allowed me to focus on the analysis rather than investing too much engineering effort in building a new data pipeline from scratch. The use of a GitHub repository allowed me to treat my data analysis experiment as code, with a number of refactoring passes, bug fixes, toil reduction automation and cheap one-off analyses.
At the end of a couple weeks of effort, I had reasonable confidence in the quality of fetched data and some preliminary analysis of runtime:
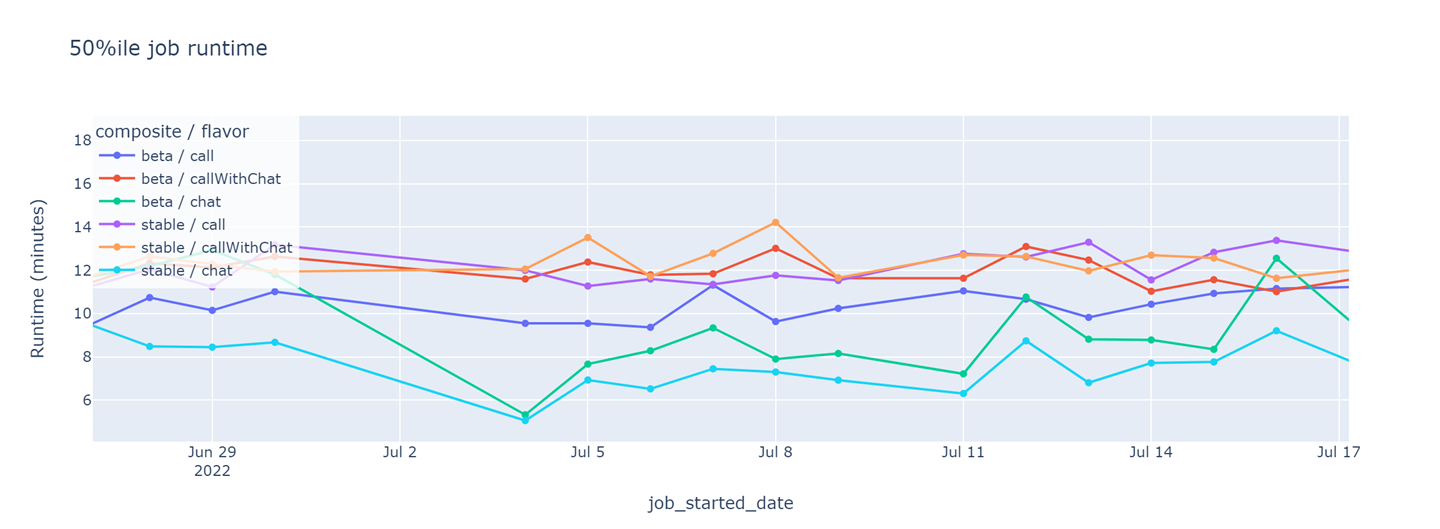
Daily median runtime of the CI jobs that run browser tests in pre-submit tests. Each of these jobs runs on a separate Virtual Machine. Assuming that existing test suites are not split into smaller sets, the CI runtime is at least as long as the slowest job.
In Github Actions, each CI run is comprised of jobs that run on different virtual machines. In our CI setup, browser tests were split across several potentially concurrent jobs. I charted the median runtime of all executions in a day for each job. I found that the daily median runtime of the different browser test jobs was similar and roughly comparable to other CI jobs. I also noticed that the median runtime was stable day-over-day.
In contrast, a look at the daily 95th percentile job runtime provided my first insight:
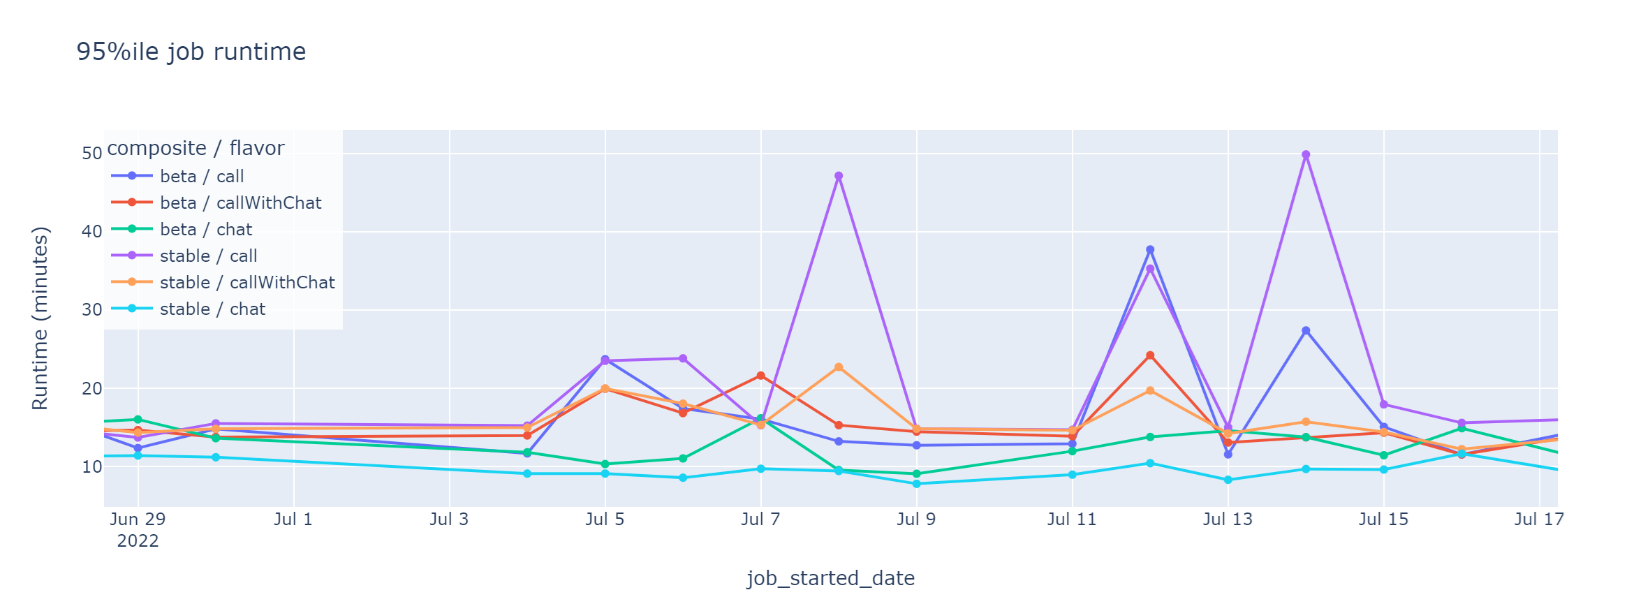
Daily 95th percentile runtime of CI jobs that run browser tests in pre-submit tests. The intermittent peaks, missing from the median graph, are symptomatic of runaway jobs skewing perception of overall CI performance.
The intermittent peaks on Jul 8, 10 and 14, missing from the graph for median runtime, were symptomatic of a skewed distribution curve for job runtime. The skew indicated that a large minority of CI jobs took much longer than average to complete. These likely contributed to the developer perception of a sluggish CI.
While I could build a big picture of the perceived CI latency with the overall job runtime graphs, I needed to drill into individual tests’ runtime to find opportunities for improvement. As an example, my first hypothesis was that the runtime peaks observed in the daily 95th percentile job runtime graphs were a result of a small set of tests that got stuck until a large global timeout.
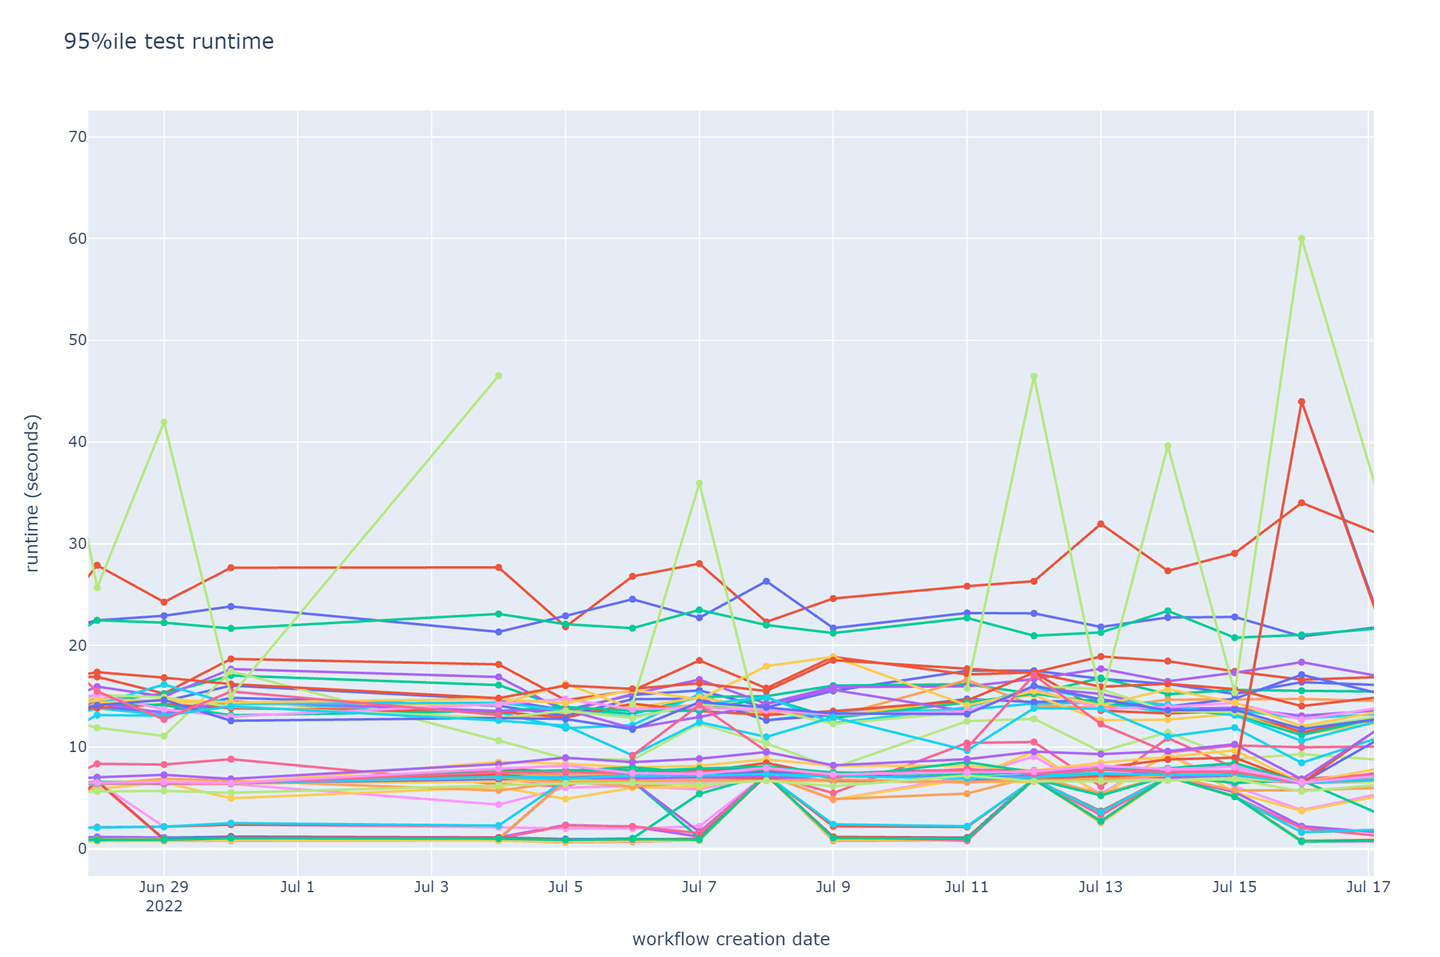
Daily 95th percentile runtime of browser tests. Each line represents a unique test in the test suite. Labels are omitted for brevity.
I was able to quickly reject this stuck-tests hypothesis after a look at the graph of daily 95th percentile runtime of each test. The graph showed similar peaks in test runtime as the daily 95th job runtime graph, but they were too small (less than 60 seconds) to account for the observed job runtime. Also, although there was a large spread in runtime across the tests (fastest tests ran in about 1 second; slowest consistently took over 25 seconds), no test had a runtime comparable to the overall job runtime. Thus, improvement to a few tests’ runtime would fail to make a large difference to the job runtime.
The individual tests’ runtime of under 30 seconds each was adding up to the sluggish 14 minutes for the entire job because the tests were forced to run sequentially (due to backend dependencies as noted above). There was a small set of tests that could run concurrently, and I found that we had neglected to run them in parallel. I merged a simple fix to parallelize these tests, but it made no observable difference to the job runtime.
At this point I was stumped. I could improve the job runtime by improving the runtime of all the tests broadly. But there was no way to find avenues of general runtime improvement. Or, I could convert a majority of the remaining tests to use fake backend implementations so that they could all be run in parallel, but I was discouraged by my failure to see a significant improvement from running the small set of existing hermetic (i.e., without external dependencies) tests in parallel.
Taking a step back, I remembered my hypothesis that the perceived latency of CI was a result of the large minority of jobs with average runtime more than twice the median. The large runtime of these jobs was not simply the result of running many slow tests. I decided to take a closer look at some instances of these outliers and soon found that the common theme across these jobs was repeated failure of a large number of tests. We had configured Playwright to retry tests on failure, and in cases where many tests failed with long timeouts for a common reason, many tests were retried and failed again. The retries quickly doubled the overall job runtime. I tried to disable all retries in Playwright, but I failed to merge my experimental Pull Request because the CI jobs could never even succeed in the absence of retries. At around the same time, a teammate posted this disheartening screenshot of the state of open pull requests in our GitHub repository:
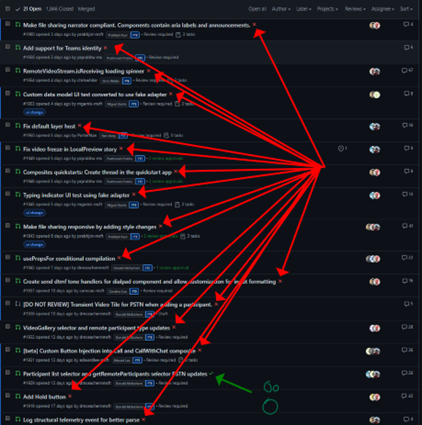
CI jobs were unsuccessful as a rule. The tests were not only being retried automatically by Playwright, developers were retrying tests by requesting CI runs repeatedly, adding a human in the loop and several hours of delay in merging otherwise good Pull Requests. Test flakiness was the real enemy!
I now needed (to analyze) more data. There is an additional challenge when analyzing test flakiness – classifying test failure as being due to flakiness (vs a legitimate failure). A test is said to have failed due to flakiness if it could have succeeded on being retried without any change in the software under test. The root cause of a flaky failure can be unreliable backend services, race conditions, or unusually strong gamma rays - anything except a flaw in the software under test. Test failures due to race conditions are special in that the race condition can either be in the test or in the software under test, but I consider the failure to be a flaky failure in both cases because it has the same effect as other flaky failures – it reduces developers’ confidence in the test suite and increases CI latency due to failures that disappear on a retry. It is difficult to classify test failures in CI as being due to flakiness or real failures because not all tests are retried (so you don’t know if it could have succeeded) and the software under test is constantly changing (so you can’t use the success of a test in other CI runs as a proxy for a test retry). It is prohibitively costly to rerun all failed tests in CI simply to determine if the original failure was due to flakiness.
Another colleague suggested the obvious solution to this problem – only consider test runs in post-submit CI. A post-submit CI runs the same tests (and more) that run pre-submit. By definition, all tests are expected to succeed. When a test fails, it is either due to a Pull Request that got merged incorrectly or due to flakiness. The former is easy to notice in a team of our size (~10 engineers give-or-take) or from some code archeology in larger teams (there is frequently a tell-tale git-revert of the incorrectly merged Pull Request). My team already had such a post-submit CI in place, so I had the data I needed. I looked at test success statistics for tests in the post-submit CI, classifying all test failures as flake:
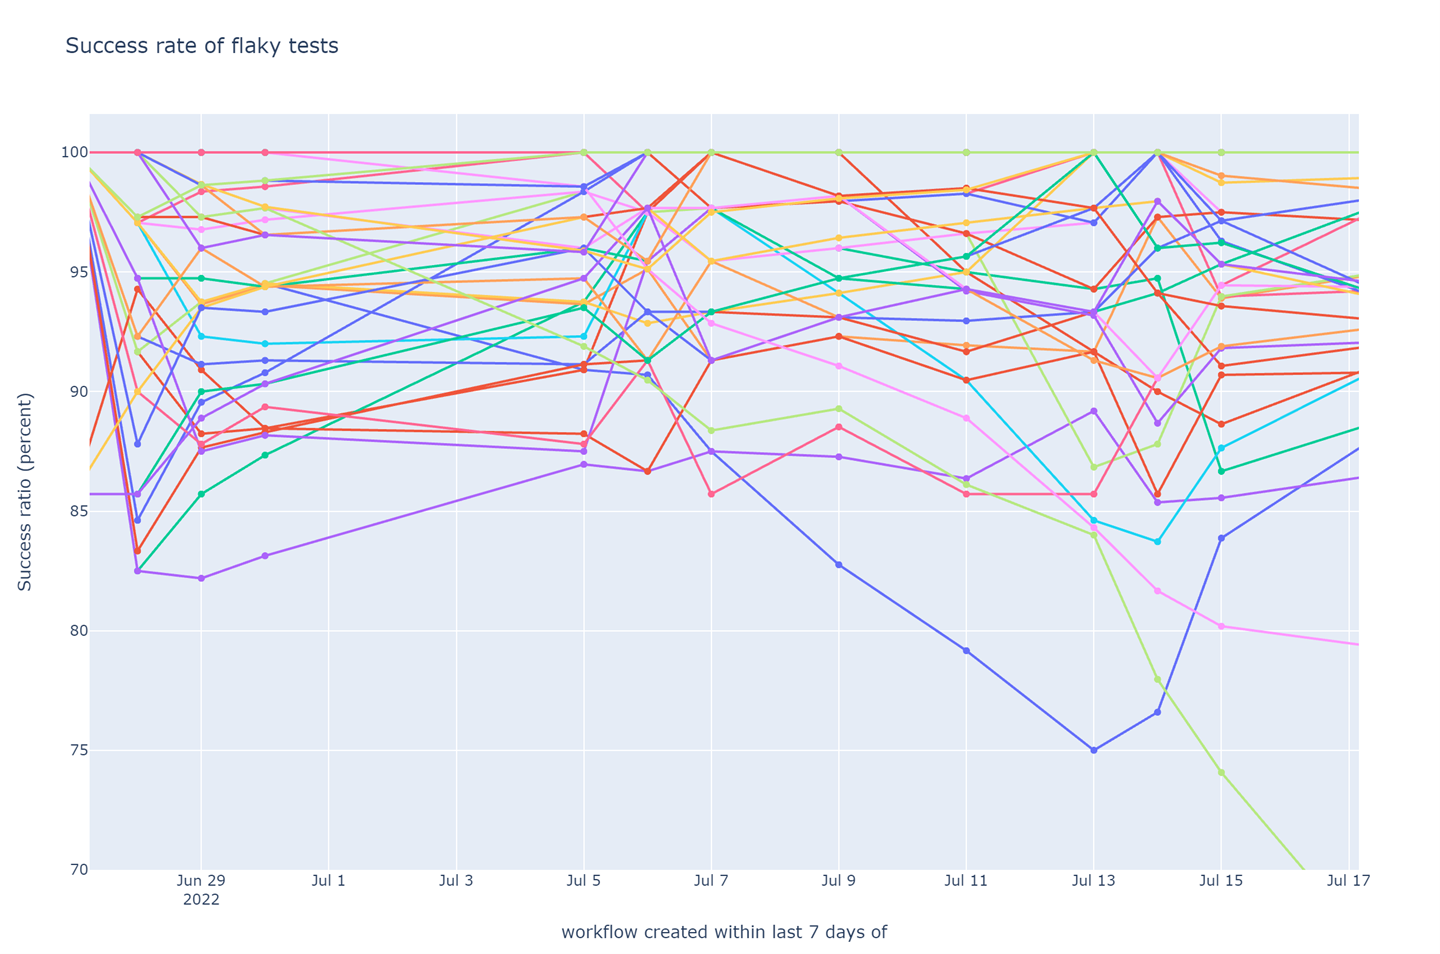
Weekly success rate of tests in post-submit CI (higher is better). The data for each day is aggregated over the preceding 7 days. Aggregation is required because there are insufficient number of post-submit CI jobs every day for reliable statistical treatment. The 7 day aggregation window also smooths cyclic data artifacts introduced by the fact that all my teammates like to spend their weekends out in the sun (or, well, in [the Raincouver](https://www.scienceworld.ca/stories/raincouver-a-legacy-of-bc-rainforests/)).
The success rate of tests was disturbingly low. A CI job only succeeds when all tests succeed (after retries). With so many tests failing over 5% of the time due to test flake, the chance of at least a few failing in each CI job was very high. I formalized this intuition of the multiplicative effect of test flake in a metric that estimated the probability of a pre-submit CI job failing due to test flakiness. I computed the metric using the test flake rate derived from the post-submit test failure analysis and the test retry configuration used in pre-submit CI.
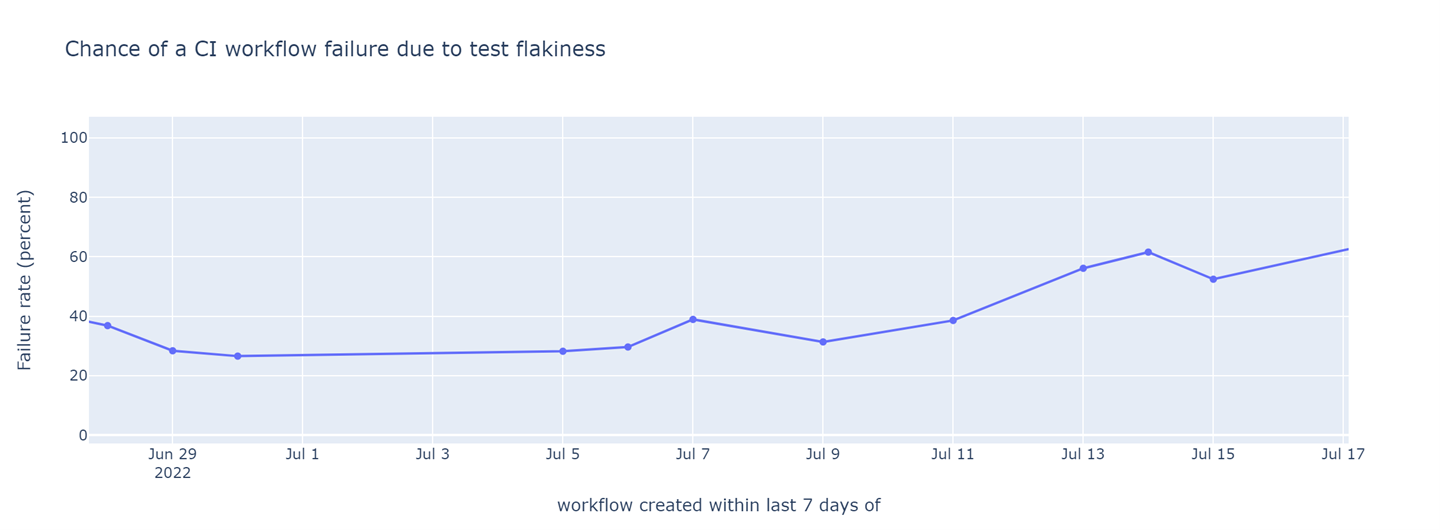
Probability of a pre-submit CI job failing due to test flakiness (lower is better). Test flake rate is derived from the post-submit test failure analysis.
This metric demonstrated that 2 out of every 5 CI runs were failing due to test flake. Considering that most Pull Requests executed more than 5 CI runs before they were merged (due to new commits), every Pull Request saw a CI failure purely due to flaky tests. This metric clearly corroborated the experience of the developers on the team. I used this metric to define a success criterion for the rest of my effort – drive the probability of a pre-submit CI job failing due to test flakiness to less than 5%.
The remaining posts in this series showcase my journey making incremental improvements to hit that target. I have picked episodes where the methods I used to detect the problem or find a solution were particularly interesting, or where the problem was plain weird. I had a ton of fun in each of those micro-obsessions. I hope you also get some vicarious pleasure from reading about these little exploits!
Next post in this series: Chapter 2: The test that would only pass two times out of five